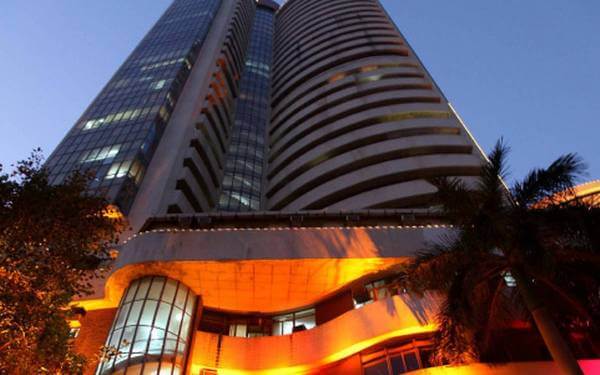
The S&P BSE Sensex hits 50,000 !
The BSE SENSEX (also known as the S&P Bombay Stock Exchange Sensitive Index or simply the SENSEX) is a free-float market-weighted stock market index of 30 well-established and financially sound companies listed on Bombay Stock Exchange.
The base value of the SENSEX was taken as 100 on 1 April 1979 and its base year as 1978–79. The journey from April 1, 1979, when the index was technically born, is dotted with many milestones.
The BSE barometer has come a long way. With a compounded annual growth rate (CAGR) of over 15 per cent, the equity gauge remains by far the most promising asset in India.
The 30 constituent companies which are some of the largest and most
actively traded stocks, are representative of various industrial sectors
of the Indian economy. Published since 1 January 1986, the S&P BSE
SENSEX is regarded as the pulse of the domestic stock markets in India.
It closed at 549 when launched on Jan 1, 1986. Today it is 50,000.
Sensex TRI -total returns index which includes dividends, is 73,600.
- 1000, 25 July 1990 - The SENSEX touched the four-digit figure for the first time and closed at 1,001 in the wake of a good monsoon and excellent corporate results.
- 10,000, 7 February 2006 – The index touched 10,003 points during mid-session.
- 20,000, 11 December 2007 – It crossed the 20,000 mark for the first time during intra-day trading, but closed at 19,977.67 points.
- 25,000, 16 May 2014 - The Sensex crossed record 25,000 level for the first time.
- 30,000, 4 March 2015 - The Sensex breaches 30,000 mark following steps taken by the Reserve Bank of India in cutting the repo rates.
- 40,000, 23 May 2019 – The Sensex crossed 40,000 for the first time.
- 50,000 21 Jan 2021 - The Sensex hits 50,000.
The real take-away from the Sensex is its passive wealth creation potential. In annualized CAGR terms it translates into 17% compounded returns over 40 years. Of course, if you add the dividend yield, it could be closer to 18.5%. Therein, probably, lives the story of wealth creation by the Sensex.
Agree that one could not have invested in Sensex earlier, as there were no Index funds then. But one could have invested in Sensex from the year 2002, when HDFC Sensex fund was launched. The fund has returned 15% CAGR, still a decent return.
