200 DMA or the 200 Day (Simple) Moving Average, is an important indicator in technical analysis. The 200 DMA is a long term moving average that helps determine overall strength of an index or a stock. The 200 DMA is generally used as a trend following indicator, which do not predicts market direction, but rather gives an idea about the current direction. Moving average is a lagging indicator, since it is based on past prices of an index or a particular stock.
An index that is trading below its 200 DMA is considered to be in a long term downtrend and when it is above, it is in an uptrend. Whenever the index or a stock trades near these averages, they attract support in a bull market and finds resistance in a bear market. Currently, the 200 DMA of Nifty is around 5200 and the index has closed around this level of 5200.
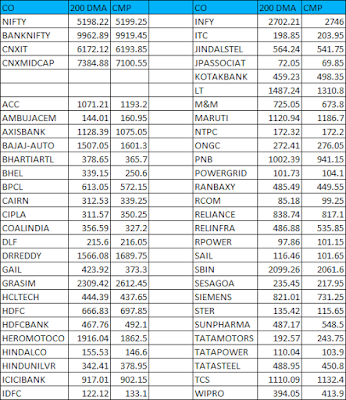
What does this indicate ? Is the market heading higher or is it going to correct after good run in the past few weeks? As said earlier during bearish phases, the 200 DMA find some resistance and attracts selling.We have seen many times in the past, nifty reacting down from the 200 DMA. But any strong close above this level would attract fresh buying and the prices may move higher. Hence, watch out these levels and follow-up action closely, to make your trading decisions better. The following chart may be of helpful, which shows the 200 DMA and the current market prices of the Nifty and Nifty-50 stocks. Also you would find the data for leading indices like Bank Nifty , CNX IT and CNX Midcap as well.
If fact, the 200-day moving average may act as support or resistance simply because it is so widely used. It is almost like a self-fulfilling prophecy. The advantage of using moving averages is they are trend following and these indicators are always lagging, This lag factor not necessarily be construed as a disadvantage, but can be used viewed as a supportive factor to identify that whether a trader is line with the current trend or not.
For a trader, trend is your friend, isn't it?
Update: 200 dma 2018
An index that is trading below its 200 DMA is considered to be in a long term downtrend and when it is above, it is in an uptrend. Whenever the index or a stock trades near these averages, they attract support in a bull market and finds resistance in a bear market. Currently, the 200 DMA of Nifty is around 5200 and the index has closed around this level of 5200.
What does this indicate ? Is the market heading higher or is it going to correct after good run in the past few weeks? As said earlier during bearish phases, the 200 DMA find some resistance and attracts selling.We have seen many times in the past, nifty reacting down from the 200 DMA. But any strong close above this level would attract fresh buying and the prices may move higher. Hence, watch out these levels and follow-up action closely, to make your trading decisions better. The following chart may be of helpful, which shows the 200 DMA and the current market prices of the Nifty and Nifty-50 stocks. Also you would find the data for leading indices like Bank Nifty , CNX IT and CNX Midcap as well.

If fact, the 200-day moving average may act as support or resistance simply because it is so widely used. It is almost like a self-fulfilling prophecy. The advantage of using moving averages is they are trend following and these indicators are always lagging, This lag factor not necessarily be construed as a disadvantage, but can be used viewed as a supportive factor to identify that whether a trader is line with the current trend or not.
For a trader, trend is your friend, isn't it?
Update: 200 dma 2018