Nifty has gone up from 2500 to 3500 in a short span of time. I am receiving lot of emails and queries about, what an investor should now? Buy or wait for a decline? What's in store next? Let us take a look at current nifty chart and try to assess what has happened and what could be expected in the near term.
A rewind of markets in Oct 2008:
Nifty touched an intra-day low 2250 and a closing around 2500 in Oct-2008. Couple of times markets tried to break those closing lows of 2500 in Nov-08 and March-09. But those closing lows haven't been breached yet. And equally the market faced resistances at 3150 and came down from those levels more than 3 times.
Now the markets have broken those range 2500/3150 on the upside, to trade around these levels of 3500. This rally has been mainly helped Global rally and Strong FII flows. How far this rally can go ?
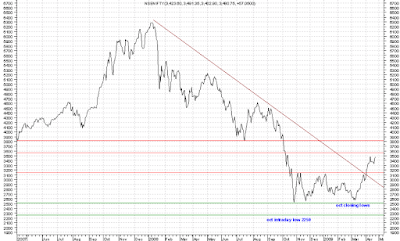
Technically the markets have risen very sharply and it is usually the case with bear market rallies. Above 3550, crucial resistances are at 3650 and 3820, which is the 38% retracement of the. Currently , the trading interest is high in the market indicated by open interest in derivative segment which surpassed Rs 95,000 crore, close to the highs recorded towards the end of 2007. These are signals to suggest that the market is getting overheated.
The big event due, is the election results which are due next month. Investors could wait for the event to be be out of the way, before making big ticket investments. Meanwhile traders can trade with strict stop-losses in place.
But one important point to be noted from this rally is - DO NOT TRY TO TIME THE MARKET. As an investor, if you find the stock is undervalued, go ahead and buy, irrespective of where the Nifty or Sensex is placed. Stocks mentioned in StockWatch section of this blog are large cap stocks with good fundamentals and investors can take note of these stocks.