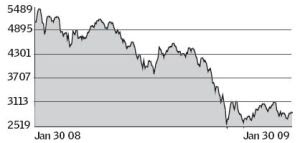
 Nifty closed the month of January 2009 down 3% at 2874, but there was full of action throughout the month.The top gainers for the month were Infosys (15%), M&M (12%), Maruti and Herohonda (10% each) and among the top losers include Siemens,Rcom and PNB (24% each).
Now looking ahead, most of the quarterly results have come out and going forward there is lack of any fresh trigger on the local news front. A close look at the Nifty chart would give an insight of current market behavior.The nifty is trading in a range of few hundred points of 2650/2800 on the lower side to 3000/3150 on the upper side.
The formation in Nifty is similar to an ascending triangle due to the two peaks formed at 3160. The up trend from 2661 can take the index higher to 2900 or 2986. In short, the area between 2900 and 3000 is a strong resistance zone. If this zone is crossed, the index can head towards 3150.
But the medium-term view for Nifty would turn positive only on a weekly close above 3150. Conversely, the area around 2500/2650 will continue to act as a good medium term support.

Break of this range would give a decisive direction to the markets. Till then one can buy around the lower range and sell on rise to the upper range.Any big negatives could come only from global cues, which could impact our markets.
Meanwhile Gold is hitting new highs closing at Rs.1450 per gram. A 5 to 10% exposure can be made on declines.